
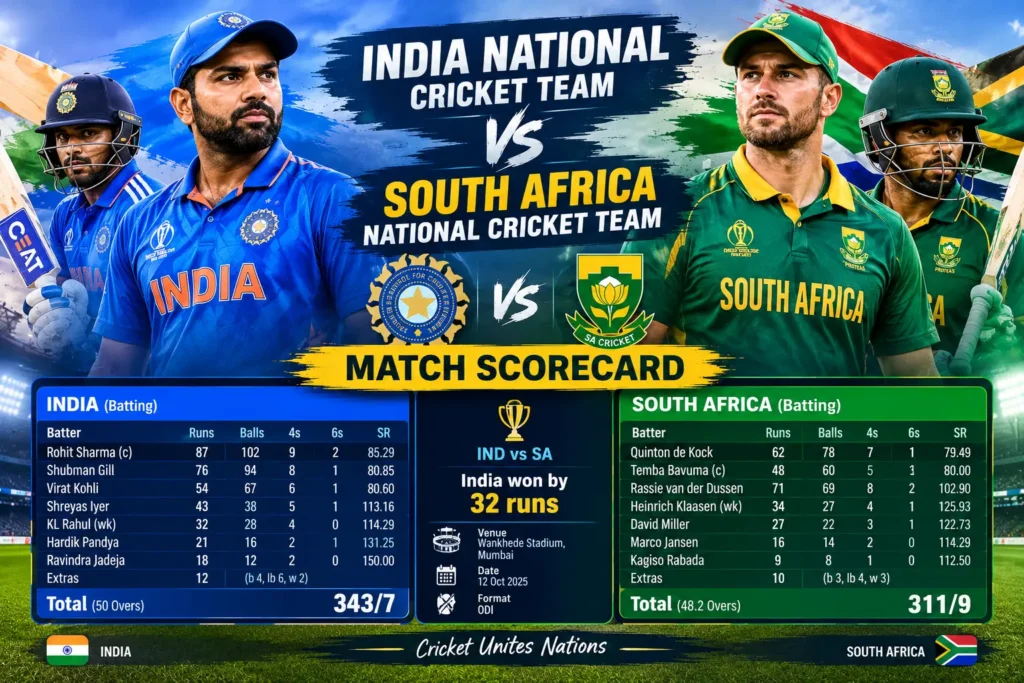
The India national cricket team vs South Africa national cricket team match scorecard provides a detailed look at one of the most competitive rivalries in international cricket. Both teams have produced memorable performances in Test matches, One Day Internationals (ODIs), and T20 Internationals (T20Is), making their meetings popular among cricket fans worldwide.
One of the major recent encounters took place on 22 February 2026 during the Super Eight stage of the ICC Men’s T20 World Cup at Narendra Modi Stadium in Ahmedabad. South Africa scored 187/7 in 20 overs before bowling India out for 111 in 18.5 overs, securing a 76-run victory. David Miller’s powerful innings and Marco Jansen’s four-wicket spell were among the most important contributions in the match.
In this article, we cover the India vs South Africa full scorecard, batting performances, bowling figures, fall of wickets, match summary, key partnerships, and tactical analysis. We also explain how to find official match records and understand the statistics that shaped the result.
India National Cricket Team vs South Africa National Cricket Team Match Overview
The India vs South Africa match on 22 February 2026 was a Super Eight fixture in the ICC Men’s T20 World Cup. South Africa won the toss and elected to bat first at Narendra Modi Stadium, Ahmedabad.
India made an encouraging start with the ball, taking three early wickets and reducing South Africa to 20 runs. However, David Miller and Dewald Brevis rebuilt the innings with an important partnership. Miller scored 63 runs from 35 balls, Brevis added 45 from 29 balls, and Tristan Stubbs finished strongly with an unbeaten 44 from 24 deliveries.
South Africa reached 187/7, giving India a target of 188 runs. India’s chase struggled from the opening overs, with wickets falling regularly. Shivam Dube top-scored with 42 runs from 37 balls, but the Indian batting lineup could not build the partnerships needed to challenge the target.
| Match detail | Information |
|---|---|
| Match | India vs South Africa |
| Tournament | ICC Men’s T20 World Cup 2026 |
| Stage | Super Eight |
| Date | 22 February 2026 |
| Venue | Narendra Modi Stadium, Ahmedabad |
| Format | Men’s T20 International |
| Toss | South Africa elected to bat |
| South Africa score | 187/7 in 20 overs |
| India score | 111 all out in 18.5 overs |
| Result | South Africa won by 76 runs |
| Player of the Match | David Miller |
For the official match record, readers can consult the BCCI India vs South Africa scorecard.
India vs South Africa Full Match Scorecard
The scorecard records the runs scored by every batter, balls faced, boundaries, strike rates, dismissals, and bowling performances. Looking at both innings helps explain why South Africa won the match despite losing three early wickets.
South Africa Batting Scorecard
South Africa finished on 187/7 in 20 overs, maintaining a scoring rate of 9.35 runs per over.
| Batter | Runs | Balls | 4s | 6s | Strike rate |
|---|---|---|---|---|---|
| Aiden Markram | 4 | 7 | 0 | 0 | 57.14 |
| Quinton de Kock | 6 | 7 | 1 | 0 | 85.71 |
| Ryan Rickelton | 7 | 7 | 0 | 1 | 100.00 |
| Dewald Brevis | 45 | 29 | 3 | 3 | 155.17 |
| David Miller | 63 | 35 | 7 | 3 | 180.00 |
| Tristan Stubbs | 44* | 24 | 1 | 3 | 183.33 |
| Marco Jansen | 2 | 6 | 0 | 0 | 33.33 |
| Corbin Bosch | 5 | 6 | 1 | 0 | 83.33 |
| Kagiso Rabada | 0* | 1 | 0 | 0 | 0.00 |
| Extras | 11 | — | — | — | — |
| Total | 187/7 | 20 overs |
The asterisk indicates that a batter remained not out. Keshav Maharaj and Lungi Ngidi did not bat.
The most significant contribution came from David Miller, who scored 63 runs at a strike rate of 180.00. Brevis supported him with 45 runs, while Stubbs added an unbeaten 44 to ensure South Africa finished with a competitive total.
India Batting Scorecard
India needed 188 runs to win but were dismissed for 111 in 18.5 overs.
| Batter | Runs | Balls | 4s | 6s | Strike rate |
|---|---|---|---|---|---|
| Ishan Kishan | 0 | 4 | 0 | 0 | 0.00 |
| Abhishek Sharma | 15 | 12 | 2 | 1 | 125.00 |
| Tilak Varma | 1 | 2 | 0 | 0 | 50.00 |
| Suryakumar Yadav | 18 | 22 | 2 | 0 | 81.82 |
| Washington Sundar | 11 | 11 | 0 | 1 | 100.00 |
| Shivam Dube | 42 | 37 | 1 | 3 | 113.51 |
| Hardik Pandya | 18 | 17 | 0 | 1 | 105.88 |
| Rinku Singh | 0 | 2 | 0 | 0 | 0.00 |
| Arshdeep Singh | 1 | 2 | 0 | 0 | 50.00 |
| Varun Chakaravarthy | 0* | 3 | 0 | 0 | 0.00 |
| Jasprit Bumrah | 0 | 1 | 0 | 0 | 0.00 |
| Extras | 5 | — | — | — | — |
| Total | 111 all out | 18.5 overs |
Shivam Dube was India’s highest scorer with 42 runs. However, the team lost wickets at regular intervals, and no substantial partnership developed to put sustained pressure on the South African bowlers.
India vs South Africa Bowling Figures
Bowling figures help explain how a team controls the scoring rate and takes wickets at crucial moments. In this match, Jasprit Bumrah delivered an excellent spell for India, while South Africa’s attack collectively dismantled the Indian batting lineup.
India’s Bowling Performance
| Bowler | Overs | Maidens | Runs | Wickets | Economy |
|---|---|---|---|---|---|
| Arshdeep Singh | 4 | 0 | 28 | 2 | 7.00 |
| Jasprit Bumrah | 4 | 0 | 15 | 3 | 3.75 |
| Varun Chakaravarthy | 4 | 0 | 47 | 1 | 11.75 |
| Washington Sundar | 2 | 0 | 17 | 0 | 8.50 |
| Hardik Pandya | 4 | 0 | 45 | 0 | 11.25 |
| Shivam Dube | 2 | 0 | 32 | 1 | 16.00 |
Bumrah was India’s standout bowler, taking three wickets for only 15 runs in four overs. Arshdeep Singh also claimed two wickets. Their early breakthroughs put South Africa under pressure, but the middle and lower order recovered effectively.
Varun Chakaravarthy conceded 47 runs in four overs, while Hardik Pandya went for 45. Miller and Brevis took advantage of scoring opportunities against the bowlers who struggled to contain their attack.
South Africa’s Bowling Performance
| Bowler | Overs | Maidens | Runs | Wickets | Economy |
|---|---|---|---|---|---|
| Aiden Markram | 1 | 0 | 5 | 1 | 5.00 |
| Marco Jansen | 3.5 | 0 | 22 | 4 | 5.73 |
| Kagiso Rabada | 4 | 0 | 32 | 0 | 8.00 |
| Lungi Ngidi | 4 | 0 | 15 | 0 | 3.75 |
| Keshav Maharaj | 3 | 0 | 24 | 3 | 8.00 |
| Corbin Bosch | 3 | 0 | 12 | 2 | 4.00 |
Marco Jansen was the leading wicket-taker with four wickets for 22 runs. Keshav Maharaj took three wickets, while Corbin Bosch claimed two. Their combined performance ensured India never established a comfortable position in the chase.
Lungi Ngidi also played an important supporting role by conceding only 15 runs in four overs. His economical spell helped build pressure even without taking a wicket.
Read More: India Women’s National Cricket Team vs West Indies Women
India vs South Africa Match Summary and Key Moments
The match changed direction several times, particularly during South Africa’s first innings.
South Africa’s Early Collapse
India’s bowlers started strongly. South Africa lost three wickets for just 20 runs, putting the batting side in a difficult position. Bumrah removed key batters, while Arshdeep Singh contributed early wickets.
At that stage, India appeared capable of restricting South Africa to a relatively modest total. However, the middle order responded with an aggressive recovery.
Miller and Brevis Rebuild the Innings
David Miller and Dewald Brevis formed the key partnership of the South African innings. Rather than allowing the early wickets to dictate the match, they rotated the strike and attacked scoring opportunities.
Brevis scored 45 from 29 balls, while Miller made 63 from 35 balls. Their contributions shifted the momentum and gave South Africa a platform for a strong finish.
Stubbs Provides Late Acceleration
Tristan Stubbs remained unbeaten on 44 from 24 balls. His late contribution helped South Africa reach 187/7, a total that demanded a strong response from India.
The target was challenging because India needed to maintain a high scoring rate without losing too many wickets.
India’s Chase Falls Apart
India’s innings began poorly, and the early dismissals put the team under immediate pressure. The South African bowlers continued to attack the stumps and use disciplined lengths, preventing India’s top order from building a partnership.
Shivam Dube offered resistance with 42 runs, but the wickets around him meant that India could not mount a serious chase. South Africa eventually secured a 76-run victory.
Top Batting Performances in India vs South Africa
The best batting performances in the match came from David Miller, Dewald Brevis, Tristan Stubbs, and Shivam Dube.
David Miller: Player of the Match
Miller scored 63 runs from 35 deliveries, including seven fours and three sixes. His strike rate of 180.00 helped South Africa recover from the loss of early wickets.
His innings was important because it combined boundary hitting with an understanding of the match situation. Rather than forcing every delivery, Miller built his innings and increased the scoring rate as the partnership developed.
Dewald Brevis: Crucial Middle-Order Support
Brevis scored 45 from 29 balls, with three fours and three sixes. His attacking contribution prevented India from maintaining pressure after the early breakthroughs.
Tristan Stubbs: An Unbeaten Finish
Stubbs’ 44 not out from 24 balls gave South Africa valuable late runs. His strike rate of 183.33 helped the team move towards a total of 187.
Shivam Dube: India’s Top Scorer
Dube scored 42 from 37 balls, including three sixes. Although his innings was India’s highest individual score, the slow progress of the chase and the loss of wickets made it difficult for him to change the result.
Best Bowling Performances in the Match
Marco Jansen was the most successful bowler in the India vs South Africa match scorecard. He finished with figures of 4/22 in 3.5 overs, taking important wickets at different stages of India’s chase.
Keshav Maharaj claimed three wickets for 24 runs, putting additional pressure on India’s middle order. His spell helped South Africa break partnerships before they could develop into a sustained recovery.
Corbin Bosch took two wickets for 12 runs in three overs. His economical spell was another key factor in South Africa’s defence of the target.
For India, Bumrah’s figures of 3/15 were exceptional. His performance demonstrated that India had the bowling ability to challenge South Africa, but the batting side could not convert those early breakthroughs into a winning result.
India vs South Africa Fall of Wickets and Partnerships
Fall-of-wickets data shows when a team lost its batters and how those dismissals affected the innings.
South Africa Fall of Wickets
South Africa lost Quinton de Kock at 10, Aiden Markram at 12, and Ryan Rickelton at 20. The team then recovered through the partnership between Brevis and Miller.
| Wicket | Score | Batter dismissed |
|---|---|---|
| 1 | 10 | Quinton de Kock |
| 2 | 12 | Aiden Markram |
| 3 | 20 | Ryan Rickelton |
| 4 | 117 | Dewald Brevis |
| 5 | 152 | David Miller |
| 6 | 158 | Marco Jansen |
| 7 | 167 | Corbin Bosch |
The partnership between Brevis and Miller was the turning point. Their stand moved South Africa from a vulnerable position to a strong total, while Stubbs’ late hitting provided further momentum.
India Fall of Wickets
| Wicket | Score | Batter dismissed |
|---|---|---|
| 1 | 0 | Ishan Kishan |
| 2 | 5 | Tilak Varma |
| 3 | 26 | Abhishek Sharma |
| 4 | 43 | Washington Sundar |
| 5 | 51 | Suryakumar Yadav |
| 6 | 86 | Hardik Pandya |
| 7 | 86 | Rinku Singh |
| 8 | 88 | Arshdeep Singh |
| 9 | 111 | Shivam Dube |
| 10 | 111 | Jasprit Bumrah |
India’s biggest partnership was 35 runs between Hardik Pandya and Shivam Dube. The team needed a much larger stand to keep the required run rate under control, but wickets continued to fall.
India vs South Africa Match Analysis: Why Did South Africa Win?
South Africa won because the team recovered from an early collapse and then defended its total with disciplined bowling. The result was not determined by one performance alone; batting recovery, middle-over pressure, and effective wicket-taking all contributed.
First, the partnership between Miller and Brevis changed the match. India had made an excellent start with the ball, but the South African batters rebuilt the innings and raised the scoring rate. Stubbs then added important runs at the end.
Second, South Africa used its bowling options effectively. Jansen’s pace and bounce produced four wickets, Maharaj’s spin created further pressure, and Bosch contributed with both control and breakthroughs.
Third, India lost too many wickets early in the chase. Once the top order fell, the remaining batters had to rebuild and score quickly at the same time. Dube’s 42 showed resistance, but he did not receive enough support to turn the chase around.
Finally, South Africa’s fielding and tactical execution helped prevent partnerships from developing. The team maintained pressure through the middle overs and dismissed India before the end of the innings.
India vs South Africa Head-to-Head Record
India and South Africa have a long history in international cricket, competing across Test matches, ODIs, and T20Is. Their rivalry includes major ICC tournament encounters, bilateral series, close finishes, and matches shaped by different conditions.
A meaningful India vs South Africa head-to-head comparison should separate the formats because each has different rules and strategic demands.
- Test cricket: Results are influenced by batting endurance, pitch conditions, bowling depth, and the ability to take 20 wickets.
- ODI cricket: Teams balance innings construction with acceleration during the final overs.
- T20I cricket: Power hitting, death-over bowling, and short periods of momentum often have a greater impact.
For accurate historical records, use a trusted cricket database and verify the date on which the statistics were last updated. Head-to-head totals can change as new matches are played, so avoid publishing an undated win-loss figure.
The February 2026 T20 World Cup meeting is particularly notable because South Africa ended India’s 12-match winning streak in T20 World Cup matches with a 76-run victory. The official ICC match report explains how South Africa recovered from 20/3 before restricting India to 111.
India vs South Africa Team Performance Comparison
The final scorecard highlights the difference between the two teams’ innings.
| Match metric | South Africa | India |
|---|---|---|
| Total runs | 187 | 111 |
| Wickets lost | 7 | 10 |
| Overs | 20.0 | 18.5 |
| Highest individual score | David Miller, 63 | Shivam Dube, 42 |
| Best bowling figures | Marco Jansen, 4/22 | Jasprit Bumrah, 3/15 |
| Result | Won by 76 runs | Lost by 76 runs |
South Africa’s recovery after losing early wickets was the key batting difference. India, by contrast, failed to build a similar partnership during the chase.
The bowling comparison also illustrates why individual figures should be considered alongside the final result. Bumrah had the best economy among the leading bowlers in the match, but South Africa’s attack took wickets more consistently across the Indian innings.
What the Scorecard Tells Us About Both Teams
The India vs South Africa scorecard offers several lessons about T20 cricket. A strong start with the ball does not guarantee success if the opposition can rebuild through the middle order. South Africa demonstrated the importance of partnerships and late acceleration.
For India, the match highlighted the challenge of chasing a high total after early wickets. Even a capable batting lineup can struggle when the required run rate rises and partnerships fail to develop.
The match also showed the importance of bowling depth. South Africa had multiple bowlers who could take wickets or restrict scoring, making it difficult for India to rely on one batter.
Individual statistics are useful, but they should always be interpreted in context. The value of Miller’s 63, Jansen’s four wickets, and Bumrah’s three wickets becomes clearer when considered alongside the match situation and the final result.
Where to Find the Official India vs South Africa Scorecard
Readers looking for the full India national cricket team vs South Africa national cricket team match scorecard should prioritize official match centres and established cricket publications. These sources provide verified totals, individual batting figures, bowling statistics, dismissals, and match results.
The BCCI scorecard is useful for checking the match details and innings totals, while the ICC report offers additional context about the tournament and the significance of the result. Always confirm the match date and format before comparing figures, especially when India and South Africa have played several matches in different competitions.
For live matches, scores update as play progresses. A final scorecard becomes available once the match is complete and the official result has been confirmed.
Frequently Asked Questions
Who won the India vs South Africa match on 22 February 2026?
South Africa defeated India by 76 runs in the Super Eight stage of the ICC Men’s T20 World Cup 2026.
What was India’s score against South Africa?
India were bowled out for 111 in 18.5 overs while chasing a target of 188 runs.
What was South Africa’s score against India?
South Africa scored 187/7 in 20 overs after winning the toss and choosing to bat first.
Who was the highest scorer in the India vs South Africa match?
David Miller was the highest scorer with 63 runs from 35 balls. His innings included seven fours and three sixes.
Who was the Player of the Match?
David Miller received the Player of the Match award for his important contribution to South Africa’s total.
Who took the most wickets in the match?
Marco Jansen was the leading wicket-taker, claiming four wickets for 22 runs. Keshav Maharaj also made a major contribution with three wickets.
What were Jasprit Bumrah’s bowling figures?
Bumrah took three wickets for 15 runs in four overs, making him India’s most economical bowler among those who completed a full four-over spell.
Where can I check the full India vs South Africa scorecard?
The BCCI match centre provides the official scorecard, while the ICC match report offers verified details and context for the 22 February 2026 T20 World Cup match.
Are Test, ODI, and T20I scorecards different?
Yes. Test matches can include two innings per team and may last up to five days. ODIs generally have a maximum of 50 overs per side, while T20Is have a maximum of 20 overs per side.
Why is the India vs South Africa head-to-head record important?
The head-to-head record helps readers understand the teams’ historical rivalry. It should be separated by format and updated as new international matches take place.
Final Verdict
The India national cricket team vs South Africa national cricket team match scorecard from 22 February 2026 records a convincing 76-run victory for South Africa in the ICC Men’s T20 World Cup Super Eight. South Africa recovered from an early collapse to post 187/7, led by David Miller’s 63, Dewald Brevis’ 45, and Tristan Stubbs’ unbeaten 44.
India struggled during the chase and were dismissed for 111 in 18.5 overs. Marco Jansen’s four-wicket spell and Keshav Maharaj’s three wickets ensured South Africa maintained control of the match.
For readers, the scorecard provides more than the final result: it explains how partnerships, bowling pressure, and the loss of wickets shaped the outcome. When publishing this article, keep the match date clearly visible and use verified statistics so readers can distinguish this fixture from other India vs South Africa Test, ODI, and T20I encounters.